Introduction - WHY, WHAT, and HOW to Implement BPA
Overview of BPA
Business Process Automation (BPA) focuses on using technology to streamline and automate routine business tasks, enhancing efficiency, reducing errors, and freeing up valuable human resources for higher-level work.
BPA serves as a critical enabler, offering organizations the potential to meet regulatory standards, scale operations, and achieve a measurable return on investment.
Implementing BPA plays a crucial role in eliminating workplace chaos and fostering a healthier working environment.
By automating repetitive tasks and establishing clear workflows, BPA reduces stress and confusion among employees, leading to increased job satisfaction.
Knowledge workers, freed from mundane tasks, can focus on more meaningful and creative aspects of their work, resulting in higher engagement levels.
This shift towards a more organized and efficient workplace directly impacts employee happiness, as individuals feel more valued and productive.
Ultimately, the reduction in workplace chaos through BPA contributes to improved mental well-being, better work-life balance, and a more positive organizational culture, all of which are essential for attracting and retaining top talent in today's competitive job market.
WHY Automate?
The Case for Business Process Automation
BPA offers substantial benefits that drive organizational efficiency and competitiveness.
By automating routine tasks, BPA reduces operational costs and frees up resources for more strategic initiatives.
Automation also streamlines workflows, which improves productivity and ensures tasks are completed more quickly and consistently.
Additionally, BPA enhances data accuracy, supporting compliance with regulatory standards and reducing human error.
As organizations grow, BPA fosters scalability, enabling them to handle higher volumes without compromising on quality.

WHAT to Automate?
Identifying & Prioritizing Processes
Identifying and prioritizing processes for automation is one of the most critical—and often challenging—tasks in Business Process Automation (BPA).
Not all processes benefit equally from automation, so selecting the right ones is key to maximizing return on investment (ROI) and achieving desired outcomes.
The challenge lies in evaluating each process based on factors such as time saved, the impact on data quality, and the contribution to organizational scalability and compliance.
Prioritizing these processes strategically helps organizations achieve efficiency while meeting regulatory and business objectives, ensuring that automation efforts are both targeted and impactful.
Prioritizing Processes by ROI
By considering these three factors, organizations can prioritize automation initiatives that will yield the highest ROI, balancing immediate operational benefits with long-term strategic advantages.
1. Saved Work Hours and Resource Optimization
This factor is critical as it directly impacts the efficiency and cost-effectiveness of the organization. By automating processes that save significant work hours, companies can reallocate human resources to more valuable tasks and optimize their workforce.
2. Improved Data Quality for Regulatory Compliance
This aspect is vital for businesses operating in regulated industries. Automating processes that enhance data accuracy can significantly reduce compliance risks and potential penalties. It also ensures that the organization meets regulatory standards more consistently.
3. Enhanced Quality and Scalability
This factor is crucial for long-term business growth and competitiveness. Automated processes can deliver more consistent results, reduce errors, and allow the organization to handle increased workloads without a proportional increase in resources. This scalability is essential for businesses looking to expand or improve their operational efficiency.

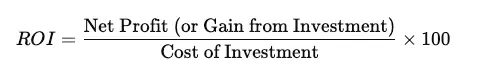
ROI Calculation method
Calculating the ROI of automating a process involves comparing the projected savings with the automation costs. Start by analyzing current metrics—work hours, employee costs, and process volume—to understand the baseline.
Estimate time and cost savings from reduced labor and improved data accuracy, particularly for regulatory compliance. Assess scalability gains, projecting the value of increased capacity without additional hires.
Factor in both upfront and ongoing automation costs (software, maintenance)
ROI=Total Savings−Total Cost of Automation
This amount indicates the financial return, aiding in prioritizing automation initiatives with the highest impact.
Here is a list of steps for calculating the ROI of your initiatives.
- Define the Current Process Metrics
- Objective: Understand the current state to measure improvements accurately.
- Metrics to Quantify:
- Total work hours spent on the process per week/month.
- Number of employees involved and average hourly wage.
- Frequency and volume of the process (e.g., daily transactions, reports generated).
- Estimate the Potential Time Savings
- Objective: Identify time reductions through automation.
- Metrics to Quantify:
- Percentage of time expected to be saved through automation (typically from benchmarks or pilot testing).
- Calculate time saved per month by multiplying the percentage saved by the total work hours of the process.
- Quantify Resource Cost Savings
- Objective: Determine cost savings from reduced manual involvement.
- Metrics to Quantify:
- Multiply saved work hours by the average hourly wage of employees involved.
- Factor in any additional reductions in overtime, temporary staffing, or other personnel-related costs.
- Assess Data Quality Improvement for Compliance
- Objective: Quantify value added by improved data accuracy.
- Metrics to Estimate:
- Potential reduction in compliance risk and fines due to improved data quality.
- Estimate cost savings from reduced data errors (consider time spent correcting errors and associated labor costs).
- Estimated value of increased data accuracy if it directly impacts revenue (e.g., better decision-making from accurate reporting).
- Estimate Scalability and Quality Gains
- Objective: Project the financial impact of handling increased volume without added resources.
- Metrics to Quantify:
- Potential increase in transaction or processing capacity (volume) post-automation.
- Avoided costs for hiring additional personnel or investing in extra infrastructure due to increased capacity.
- Calculate Total Cost of Automation
- Objective: Determine upfront and ongoing costs for accurate ROI.
- Metrics to Quantify:
- Initial costs: software, hardware, implementation, and integration expenses.
- Ongoing costs: maintenance, subscription fees, and any additional support or training required.
- Calculate ROI
- Formula:
- Formula:
- Total Savings: Add up all quantified savings from time, resources, compliance, and scalability improvements.
- Result: This ROI percentage will show the financial return on automating the process, helping prioritize it against other candidates.
ROI Calculation example
Use Case Example
ROI Calculation for Automating Monthly Financial Reporting
Company Situation:
A mid-sized company currently has a manual process for generating monthly financial reports, which involves data collection, analysis, and report generation. The goal is to automate this process to save time, reduce labor costs, improve accuracy, and prepare for scaling the report frequency.
Step 1: Define the Current Process Metrics
- Objective: Establish a baseline to measure improvements post-automation.
- Metrics Calculated:
- Total work hours: 160 hours per month are dedicated to report generation.
- Number of employees involved and hourly wage: 4 employees are involved, each earning an average hourly wage of $35.
- Frequency and volume: The reporting process is performed monthly with a single report produced each time.
Step 2: Estimate the Potential Time Savings
- Objective: Project how much time automation could save in the process.
- Metrics Calculated:
- Percentage of time saved through automation: Automation is expected to save 50% of the process time.
- Total time saved per month: 160 hours * 50% = 80 hours saved monthly.
Step 3: Quantify Resource Cost Savings
- Objective: Calculate the cost reduction due to reduced manual hours.
- Metrics Calculated:
- Labor cost savings from time saved: 80 hours * $35 = $2,800 saved per month in labor costs.
- Additional personnel cost reductions: No temporary staff are used, so no additional savings are noted here.
Step 4: Assess Data Quality Improvement for Compliance
- Objective: Identify savings from enhanced data accuracy and reduced compliance risks.
- Metrics Estimated:
- Compliance risk reduction: Improved data quality reduces compliance errors by 90%, with potential annual fines totaling $5,000. Estimated savings = $5,000 * 90% = $4,500 per year.
- Savings from error reduction: An estimated 10 hours per month spent on correcting errors (costing $350 monthly) are no longer required. Annual savings: 10 hours * $35 * 12 = $4,200.
Step 5: Estimate Scalability and Quality Gains
- Objective: Project cost savings from scaling the reporting frequency without hiring additional staff.
- Metrics Estimated:
- Increased reporting capacity: Automation enables the team to double the reporting frequency (twice a month instead of once) without additional personnel.
- Avoided hiring costs: Without automation, adding two reports per month would have required hiring one additional employee, saving an estimated $42,000 in annual salary.
Step 6: Calculate Total Cost of Automation
- Objective: Calculate the investment required to automate the reporting process.
- Metrics Calculated:
- Initial costs: Software purchase, setup, and integration fees total $15,000.
- Ongoing costs: Annual maintenance and subscription fees are $5,000.
Step 7: Calculate ROI
- Objective: Determine the financial return on investment for automating the reporting process.
- Formula:
- Total Savings:
- Monthly labor savings: $2,800 * 12 = $33,600
- Compliance-related savings: $4,500
- Error reduction savings: $4,200
- Avoided hiring costs: $42,000
- Total Annual Savings: $84,300
- Total Cost of Automation:
- Initial Cost: $15,000
- Annual Ongoing Costs: $5,000
- Total Cost: $20,000
- ROI Calculation:

- Result: With an ROI of 421.5%, automating the financial reporting process represents a significant financial gain, making it a top candidate for automation among other business initiatives.
Setting SMART Goals
SMART Approach for Automation Initiatives
The SMART Approach for Automation Planning provides a structured framework to help organizations set clear, achievable goals for automation initiatives. Each component of SMART — Specific, Measurable, Achievable, Relevant, and Time-bound — guides planning to ensure automation efforts are well-defined and aligned with business objectives.

- Specific: Define clear, detailed goals for what the automation should accomplish. This includes identifying the precise tasks or processes to automate and the desired outcomes, such as reducing manual errors or speeding up response times.
- Measurable: Set quantifiable metrics to assess the success of the automation. This could involve measuring time saved, reduction in errors, cost savings, or other performance indicators that demonstrate tangible results.
- Achievable: Ensure that automation goals are realistic given available resources, technology, and budget. This step involves evaluating whether the proposed automation is feasible with current tools and team capabilities.
- Relevant: Align the automation goals with broader business objectives. Automation should support key priorities, such as improving customer service, enhancing productivity, or supporting regulatory compliance, to deliver meaningful value.
- Time-bound: Establish a timeline for implementing the automation and reaching specific milestones. Having deadlines promotes accountability and helps track progress, ensuring the project stays on schedule and within scope.
The SMART Approach helps focus automation efforts on initiatives that are clear, practical, and impactful, increasing the likelihood of achieving successful, ROI-positive outcomes.
SMART Objectives definition example
Goal: Automate the monthly financial reporting process to reduce time and labor costs, enhance data accuracy, and enable scalability.
1. Specific
The objective is to automate the data collection, analysis, and report generation steps of the monthly financial reporting process. By doing so, the company aims to:
- Save 50% of the time currently spent on these tasks (80 hours per month).
- Eliminate manual errors associated with data handling.
- Increase reporting frequency from once per month to twice per month within the next year.
2. Measurable
Success will be tracked by:
- Monthly labor savings of $2,800, totaling $33,600 annually.
- Reducing compliance-related error costs by $4,500 per year.
- Eliminating $4,200 in error correction costs and avoiding $42,000 in hiring costs due to improved scalability.
- Achieving a total savings of $84,300 annually.
3. Achievable
Automation is feasible with the current budget and resources:
- Initial setup cost of $15,000 for software and integration is within budget.
- Annual ongoing maintenance costs of $5,000 are also budgeted, with staff trained to manage the new system.
- The project timeline is realistic, with expected completion within six months, and pilot testing can validate time savings and error reduction.
4. Relevant
Automating the financial reporting process supports the company’s objectives by:
- Reducing manual labor and increasing efficiency.
- Mitigating compliance risks and improving data quality, which aligns with regulatory priorities.
- Preparing the finance team for anticipated growth in reporting needs without additional hires, supporting scalability and cost management.
5. Time-bound
The project is scheduled as follows:
- Implementation Start Date: Q1 of the fiscal year.
- Pilot Testing Completion: Within 3 months of implementation.
- Full Automation Rollout: By the end of Q2.
- Review Milestone: A six-month post-implementation review to assess ROI and ensure the projected 322% ROI is on track.
Ancora nessun commento.
per essere il primo a scrivere un commento.